
Churn Prediction Feature Engineering: The Pipeline SaaS Teams Get Wrong
Learn how to build a churn prediction feature engineering pipeline for SaaS using Snowflake and dbt. Avoid common mistakes and ship models that actually predict churn.
Introduction
Most SaaS teams that invest in a churn prediction model end up disappointed, and the problem rarely lies in the algorithm. It lives in the features. The data you extract, transform, and feed into your churn scoring model determines whether you get actionable retention signals or noise dressed up as insight. Yet the typical approach treats feature engineering as an afterthought: pull a few aggregate usage counts from the warehouse, bolt them onto a gradient boosting classifier, and wonder why precision sits below 60%. The real gap is not in what model you pick. It is in how you translate raw event streams into behavioral features that capture the trajectory of a customer, not just their snapshot.

Why Feature Engineering Breaks Before Modeling Begins
The churn prediction pipeline fails at the feature layer because teams conflate data availability with data relevance. Having millions of rows of event data in Snowflake does not mean those rows contain a predictive signal. Most teams default to surface-level aggregates because they are easy to compute, and they skip the harder work of encoding behavior over time.
Vanity Metrics That Poison Your Feature Set
The most common mistake in churn prediction data engineering is treating raw counts as meaningful features. Total logins, page views, and session counts might look useful in a dashboard, but they carry almost no predictive weight in isolation. Here is what typically goes wrong:
Raw login counts: A user who logs in 30 times but only visits settings is not engaged; frequency without depth is misleading.
Aggregate page views: Total views across an entire account, ignoring which features were used, making it impossible to distinguish exploration from habitual use.
Time-since-last-login as a standalone: This captures recency but ignores the rhythm of usage, missing the difference between a weekly user who skipped a week and a daily user who vanished.
Binary feature flags: Encoding "used feature X: yes/no" over a 90-day window flattens all behavioral nuance into a coin flip.
Account-level averages: Averaging metrics across all users on an account masks the disengagement of key stakeholders whose departure predicts churn.
The Granularity Problem in Event Data
Even when teams move beyond vanity metrics, they often stumble on event taxonomy issues. If your tracking layer collapses distinct user actions into generic event names like "click" or "pageview," the feature engineering layer inherits that ambiguity. A well-structured taxonomy that distinguishes between "report_exported," "dashboard_shared," and "filter_applied" gives your pipeline raw material that actually differentiates engaged accounts from those drifting toward cancellation.
Granularity also matters at the temporal level. Storing daily aggregates instead of timestamped events means you lose the ability to compute intra-day patterns, session depth, and behavioral signals that predict churn before it shows up in monthly reporting. If your warehouse only holds pre-aggregated data, your churn prediction features will always lag behind the actual behavioral shift.

Building a Feature Engineering Pipeline That Predicts Churn Accurately
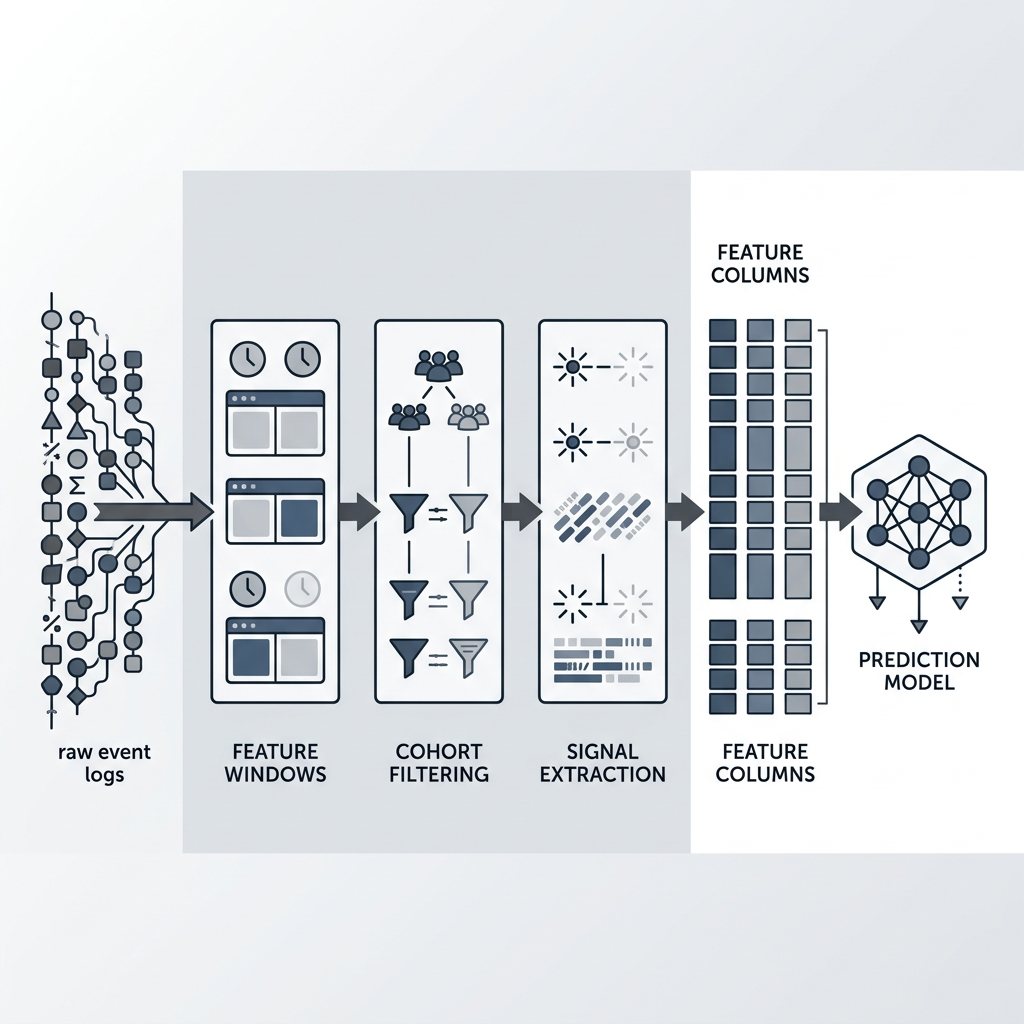
A reliable churn prediction pipeline needs three layers: cohort-aware windowing, behavioral signal extraction, and a feature store that keeps everything versioned and reproducible. This is where DBT and Snowflake becomes the backbone of the workflow, not just storage and transformation tools, but the architecture for building features that a machine learning churn prediction system can actually use.
Cohort-Based Feature Windows and Behavioral Extraction
The single most impactful pattern in churn prediction feature engineering is windowed feature computation relative to a cohort's lifecycle stage. Instead of computing "average sessions in the last 30 days" globally, compute it relative to when each account is onboarded, when they hit activation milestones, and where they sit in their contract cycle. A 30-day-old account with declining usage has a fundamentally different churn profile than a 300-day-old account with the same decline.
In practice, this means building dbt models that join your cohort analysis tables with event-level data and compute features within sliding windows: 7-day, 14-day, and 30-day lookbacks anchored to each observation date. The features that matter most are rate-of-change metrics. Week-over-week change in core feature usage, the ratio of active users to total seats on an account, and the decay rate of engagement after onboarding all outperform static aggregates. Use SQL window functions to compute rolling averages and deltas efficiently inside Snowflake without extracting data to Python notebooks. A study published in Machine Learning and Knowledge Extraction confirms that temporal behavioral features consistently outperform static demographic or firmographic attributes in subscription churn models.
Integrating dbt and Snowflake for Reproducible Feature Sets
The operational mistake many teams make is building features in ad hoc notebooks that cannot be versioned, tested, or scheduled. Churn prediction DBT integration solves this by treating every feature as a modeled transformation with lineage, tests, and documentation. Your staging layer ingests raw events. Your intermediate layer computes windowed aggregates and behavioral ratios. Your mart layer outputs a single spine table: one row per account per observation date, with every feature as a column.
Snowflake's semi-structured data handling is especially useful here when your first-party data infrastructure captures properties as JSON payloads on each event. You can extract nested fields like plan tier, team size changes, and feature-specific metadata directly in your dbt models without flattening everything upstream. This keeps the pipeline flexible as your tracking evolves. TrackRaptor has covered extensively how warehouse-native architectures eliminate the brittle handoffs between collection, storage, and analysis that cause feature drift in production churn models.
Version your feature definitions in dbt's YAML schema files so that when a data scientist questions why a feature changed behavior, the answer is in version control, not in someone's memory. Run dbt tests to assert that no feature column has more than a defined threshold of null values and that rolling averages fall within expected bounds. This discipline is what separates a predictive churn system that runs reliably in production from one that breaks silently after two sprints.
Conclusion
The best churn prediction algorithms in the world cannot rescue a feature set built on vanity metrics and unwindowed aggregates. SaaS teams that invest in cohort-aware feature windows, behavioral rate-of-change signals, and reproducible dbt pipelines inside Snowflake will consistently outperform teams chasing model complexity. Treat your features as product usage analytics engineered for prediction, not as dashboard metrics repurposed for a notebook. The pipeline is the product, and getting it right is the difference between retention metrics that predict churn and reports that merely describe it after the revenue is gone.
Explore TrackRaptor for deep-dive guides on building warehouse-native tracking and analytics infrastructure that powers accurate churn prediction for SaaS teams.
Frequently Asked Questions (FAQs)
What data do you need for churn prediction?
You need timestamped event-level product usage data, account metadata (plan tier, seat count, contract dates), and ideally support ticket or NPS response data, all joined at the account level with consistent user identity resolution.
How to build a churn prediction model?
Start by defining your churn label (e.g., cancellation or non-renewal within 30 days), engineer cohort-windowed behavioral features from raw event data, split by time to avoid leakage, and train a gradient boosting classifier like XGBoost or LightGBM on the resulting feature set.
What are churn prediction features?
Churn prediction features are derived variables, such as week-over-week usage decline, ratio of active seats to total seats, days since last core-feature interaction, and onboarding milestone completion rates, that quantify customer engagement trajectories for a classification model.
How to measure churn prediction accuracy?
Use precision-recall curves and the F1 score rather than raw accuracy, because churn datasets are imbalanced; also, evaluate lift in the top decile of risk scores to confirm the model surfaces actionable accounts for your retention team.
Can server-side tracking improve churn prediction?
Yes, because server-side tracking captures events that client-side scripts miss due to ad blockers and browser restrictions, resulting in more complete and reliable event data that produces higher-fidelity features for your prediction pipeline.