
Semantic Layer Architecture: How to Build One That Scales
Learn how to design a semantic layer architecture that scales across your data warehouse. A practical guide covering tooling, governance, and implementation patterns.
Introduction
Every SaaS data team eventually hits the same wall: three dashboards showing three different numbers for the same metric, and nobody can explain which one is right. The root cause is almost always the absence of a well-designed semantic layer architecture sitting between the warehouse and the consumption tools. Building this layer is not just a "nice to have" for mature data teams. It is the single most impactful investment for consistent, governed, and scalable analytics. The difference between teams that get this right and those that don't comes down to a handful of architectural decisions made early, and the cost of getting them wrong compounds with every new metric, dashboard, and downstream consumer added to the stack.

Positioning the Semantic Layer in Your Data Stack
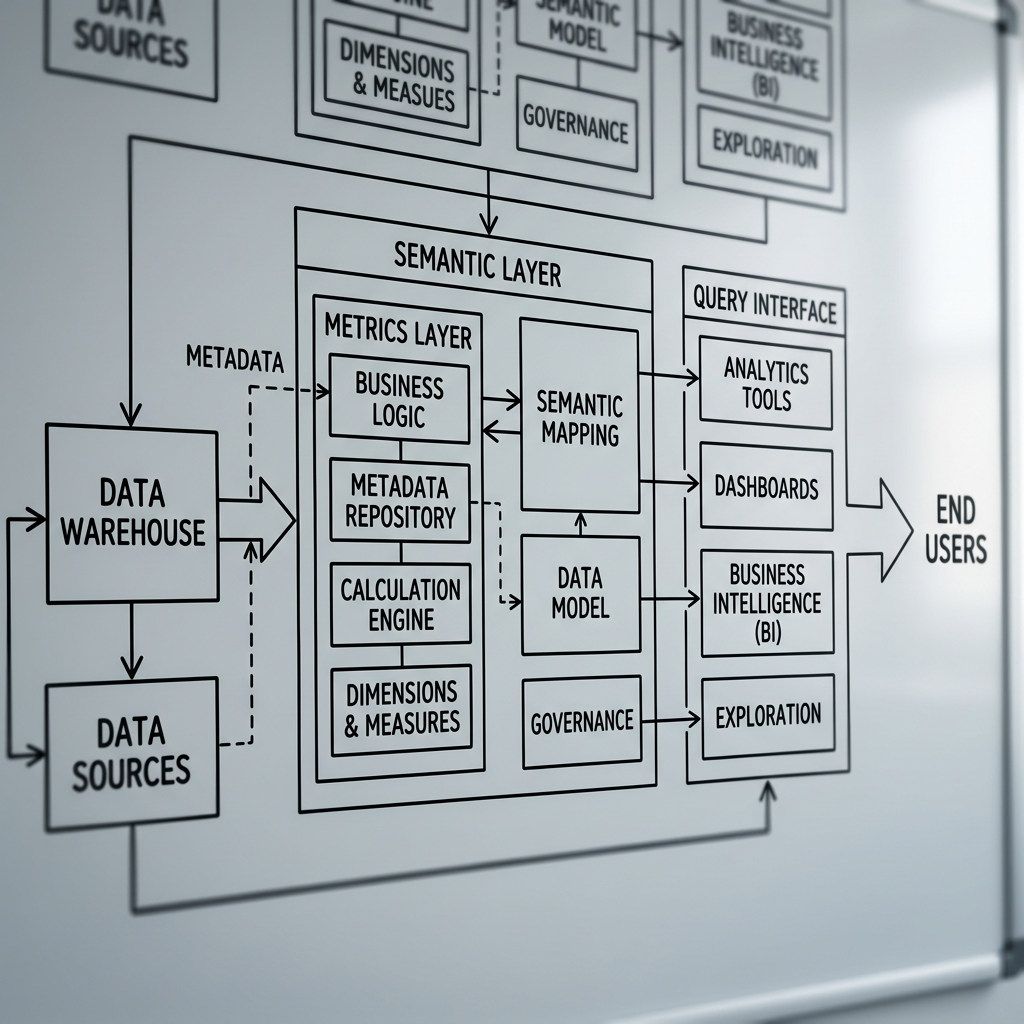
Before choosing a tool or writing a single metric definition, the first architectural decision is placement. Where your semantic layer sits relative to the data warehouse, transformation layer, and consumption tools determines its effectiveness and its failure modes.
Warehouse-Native vs. Standalone Deployment
Two dominant patterns exist for semantic layer implementation today, and each comes with real trade-offs. Understanding these patterns before committing to a tool prevents costly re-architecture down the line.
Warehouse-native pattern: The semantic layer lives inside or tightly coupled to the warehouse (Snowflake, BigQuery, Databricks), leveraging native compute for query execution and reducing data movement.
Standalone middleware pattern: A dedicated semantic engine (Cube, AtScale) sits between the warehouse and BI tools, caching and abstracting queries independently of the underlying storage.
Hybrid transformation pattern: Tools like dbt define metrics in code that compile to SQL, pushing computation to the warehouse while maintaining a version-controlled definition layer outside it.
Embedded BI pattern: Platforms like Looker embed a proprietary semantic modeling language (LookML) directly in the BI tool, coupling metric definitions to a single visualization layer.
Why Placement Decisions Break at Scale
The embedded BI pattern feels convenient at 10 dashboards and 5 analysts. With 200 dashboards and cross-functional consumers pulling metrics into reverse ETL pipelines, notebooks, and operational tools, and that tight coupling becomes a bottleneck. Warehouse-native and standalone patterns both scale better because they decouple metric definitions from any single consumption interface. The strongest position here is clear: if you are building for scale, the semantic layer must be consumption-agnostic. Any architecture that ties metric logic to a specific BI tool is borrowing convenience from the future.
Teams across North America are increasingly adopting standalone or hybrid approaches precisely because they want data democratization without sacrificing governance. The semantic layer for analytics must serve dashboards, APIs, embedded products, and AI agents equally. Designing for a single output format is designing for obsolescence.
Modeling Metrics, Dimensions, and Governance
Placement is only half the architecture. The modeling decisions inside the semantic layer determine whether it becomes the single source of truth or just another abstraction layer that nobody trusts.
Designing Metric and Dimension Models That Hold Up
A semantic layer data warehouse integration fails most often at the modeling stage. Teams rush to define 50 metrics in week one, skip dimension modeling, and end up with a brittle graph of loosely connected calculations that break when schemas change. The better approach is to start with entities, not metrics.
Define your core business entities first: customers, subscriptions, events, transactions. Map dimensions to those entities. Only then layer metrics on top as calculations that reference those dimensions. This entity-first approach mirrors how semantic layers have evolved from simple view layers into full modeling frameworks. When using the dbt semantic layer, this means defining semantic models in YAML that map directly to your warehouse tables, then composing metrics from those models using MetricFlow syntax. Each metric should declare its grain, its required dimensions, and its time-spine behavior explicitly. Ambiguity at this stage is the number one cause of inconsistent reporting downstream.
A common mistake is treating the semantic layer vs data mart comparison as an either-or decision. Data marts pre-aggregate and materialize. The semantic layer defines logic that can be computed on the fly or cached. In practice, both coexist. The semantic layer should own the definitions, and warehouse-native materializations should handle performance optimization for high-frequency queries.
Governance and Access Control as Architecture
Semantic layer data governance is not a policy document. It is an architectural component. If governance is bolted on after the semantic layer ships, it will always lag behind the pace of new metric creation. The access model should be embedded into the metric definitions themselves.
At minimum, every metric in the semantic layer should carry metadata for ownership (which team owns this metric), classification (is this PII-adjacent, financial, or public), and access tier (who can query this, and at what granularity). Modern data leader playbooks recommend treating metric governance as a first-class concern from day one, not a quarterly audit. Tools like Cube support role-based access at the metric level natively. In DBT, access controls are typically managed through the BI layer or a catalog tool like Atlan, which means governance requires coordination across multiple systems.
From a security standpoint, the semantic layer also serves as a natural enforcement point for data minimization. Rather than granting analysts direct warehouse access, route all analytical queries through the semantic layer. This approach limits exposure, creates an audit trail, and ensures every query is bounded by the governance rules encoded in the metric definitions. TrackRaptor has covered extensively how tracking governance and metric consistency are two sides of the same coin. The semantic layer is where that convergence happens in practice.

Tooling Choices and the Implementation Checklist
With placement and modeling principles established, the remaining decisions are about tooling and sequencing. This is where most teams get paralyzed by options, and where strong opinions save months of wasted evaluation cycles.
Semantic Layer Tools Comparison: What Actually Works
The dbt semantic layer (powered by MetricFlow) is the right default for teams already using dbt Core or Cloud. It keeps metric logic in version-controlled code, integrates with the transformation workflow, and pushes all compute to the warehouse. The limitation is that it depends on downstream BI tools supporting the dbt Semantic Layer API, and adoption there is still maturing. For teams that need caching, multi-source federation, or sub-second API responses, Cube is the strongest alternative. It runs as a standalone service, supports pre-aggregations for performance, and exposes metrics via REST and GraphQL APIs.
AtScale targets enterprise use cases where the semantic layer needs to serve Tableau, Power BI, and Excel simultaneously through MDX and DAX compatibility. If your organization has entrenched Microsoft BI tooling, AtScale removes significant friction. Looker's LookML remains powerful but couples you to the Looker ecosystem. For most SaaS analytics teams evaluating best semantic layer tools, the decision tree is straightforward: dbt if you are code-first and warehouse-native, Cube if you need API-first delivery, and AtScale if enterprise BI compatibility is non-negotiable.
A Practical Implementation Checklist
Knowing the right patterns and tools is necessary but insufficient. The difference between a semantic layer that ships and one that stalls in a planning document comes down to sequencing. Start with five to ten metrics that your organization argues about most frequently (ARR, active users, churn rate). Define those in the semantic layer first, validate them against existing dashboard logic, and deprecate the old definitions publicly.
Next, establish the governance metadata schema before scaling beyond those initial metrics. Require ownership, taxonomy classification, and access tier for every new metric added. This prevents the "metric sprawl" problem that enterprise data platforms have documented extensively. Then connect two or three consumption interfaces (your primary BI tool, a notebook environment, and one operational tool via reverse ETL) to prove the layer is genuinely consumption-agnostic. Only after those three phases succeed should you open the semantic layer to broader self-service adoption across the organization.
Conclusion
A semantic layer that scales is not defined by the tool you choose. It is defined by three architectural commitments: consumption-agnostic placement, entity-first metric modeling, and governance embedded as code rather than appended as policy. Teams that sequence their implementation, starting narrow with high-value metrics and expanding only after validation, avoid the most common failure mode of premature complexity. The semantic layer best practices outlined here are not theoretical; they reflect what actually works when SaaS data teams ship this infrastructure into production. TrackRaptor continues to track how these patterns evolve as AI-driven analytics place even greater demands on metric consistency and governed access.
Explore TrackRaptor's deep-dive content library on semantic layers, tracking governance, and scalable data infrastructure to keep your architecture ahead of the curve.
Frequently Asked Questions (FAQs)
How does a semantic layer work?
A semantic layer translates business metric definitions into reusable logic that sits between the data warehouse and consumption tools, ensuring every query against a given metric returns the same result regardless of which tool generates it.
Why do you need a semantic layer?
Without a semantic layer, metric definitions get duplicated across dashboards, notebooks, and pipelines, leading to conflicting numbers that erode trust and slow decision-making across teams.
How is a semantic layer different from a data mart?
A data mart pre-aggregates and materializes data for a specific business domain, while a semantic layer defines metric logic that can be computed dynamically across any domain without requiring physical materialization.
What metrics should go in a semantic layer?
Start with the metrics your organization defines inconsistently or argues about most frequently, such as revenue, churn, and active users, then expand to cover all governed KPIs as adoption matures.
How does a semantic layer support self-service analytics?
It provides business users with pre-defined, governed metrics and dimensions they can query through BI tools or APIs without needing to write SQL or understand the underlying warehouse schema.